Diagrams Support - ECharts
 Lruihao
ECharts is a library helping you to generate interactive data visualization.
 FixItTheme for HugoFixItTheme for Hugo
A Clean, Elegant but Advanced Hugo ThemeA Clean, Elegant but Advanced Hugo Theme
8 posts in 2026
10 posts in 2025
28 posts in 2024
18 posts in 2023
5 posts in 2022
3 posts in 2021
1 post in 2019
ECharts is a library helping you to generate interactive data visualization.
Mermaid is a JavaScript-based diagramming and charting tool that renders Markdown-inspired text definitions to create and modify diagrams dynamically. It lets you create diagrams and visualizations using text and code.
GoAT is a Go implementation of markdeep.mini.js’s ASCII diagram generator.
The typeit shortcode provides typing animation based on TypeIt library.
The bilibili shortcode embeds a responsive video player for bilibili videos.
The mapbox shortcode supports interactive maps in Hugo with Mapbox GL JS library.
The echarts shortcode supports data visualization in Hugo with ECharts library.
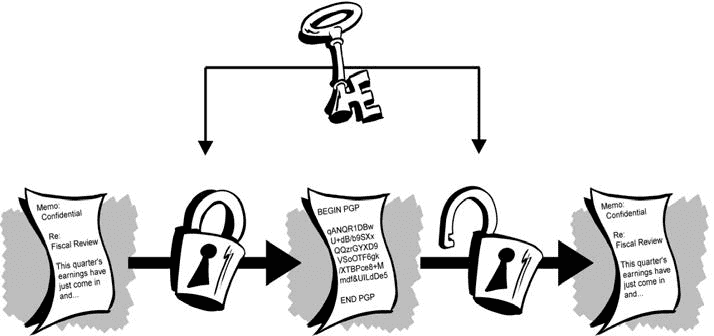
Find out how to encrypt content in FixIt theme.
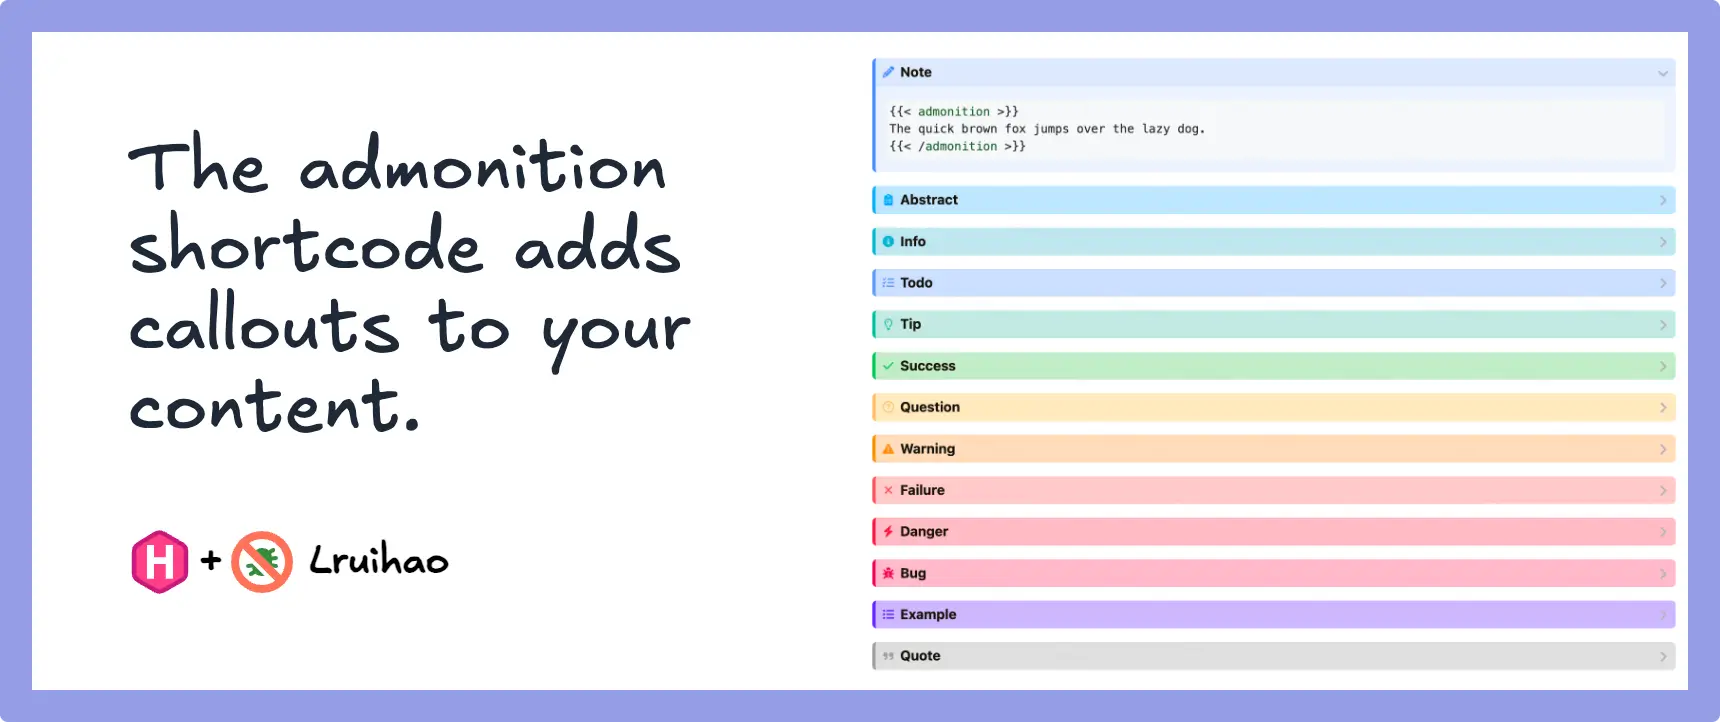
The admonition shortcode allows you to add various types of callouts to your content.